Decision Pulse AI
Designing a decision intelligence platform from scratch using AI to help businesses transform raw data into actionable insights, predictions, and strategic decisions.
Decision Pulse AI is a GenAI-powered decision intelligence platform designed to help businesses transform raw data into actionable insights, predictions, and strategic decisions.
This was a 0 → 1 product, with no prior UX, flows, or benchmarks. I was responsible for defining the entire user experience from the ground up—from research to final UI.
Problem Space
When I started, there was no existing product experience—only a high-level vision:
The core challenge: How do we design a system where users don't just see data—but make decisions from it?
Discovery & Research
Since there was no existing UX, I began with foundational research.
1. Market & Competitor Analysis
I analyzed tools like traditional BI platforms and AI-based analytics tools. The key gaps identified were:
- Tools focus on visualizing data, not guiding decisions
- Heavy reliance on dashboards
- High learning curve for non-technical users
2. User Problem Understanding
I mapped out how decisions currently happen in organizations:
Current Flow:
Pain Points
- Time-consuming
- Dependent on analysts
- Lack of predictive insights
- No clear "next step" guidance
Insight
Users don't want tools—they want clarity and direction.
Defining the Product Vision
Based on research, I defined the core product direction:
Instead of:
Dashboard-first approach
I designed for "Decision-First UX":
Insight → Recommendation → Action
Product Goals
Business Goals
- Reduce decision-making time
- Enable self-serve analytics
- Increase adoption across non-technical users
UX Goals
- Make data understandable instantly
- Enable natural interaction (chat-based)
- Provide actionable outputs
User Definition
I defined primary personas:
1. Executive Users
Need quick summaries.
Low tolerance for complexity.
2. Analysts
Need deeper control.
Validate AI outputs.
3. Business Teams
Need actionable insights.
Focused on outcomes.
Experience Strategy
From scratch, I designed the experience around 3 pillars:
1. Conversational Interface
Users interact with data like they talk to a human:
"Why did sales drop?"
"What should we do next?"
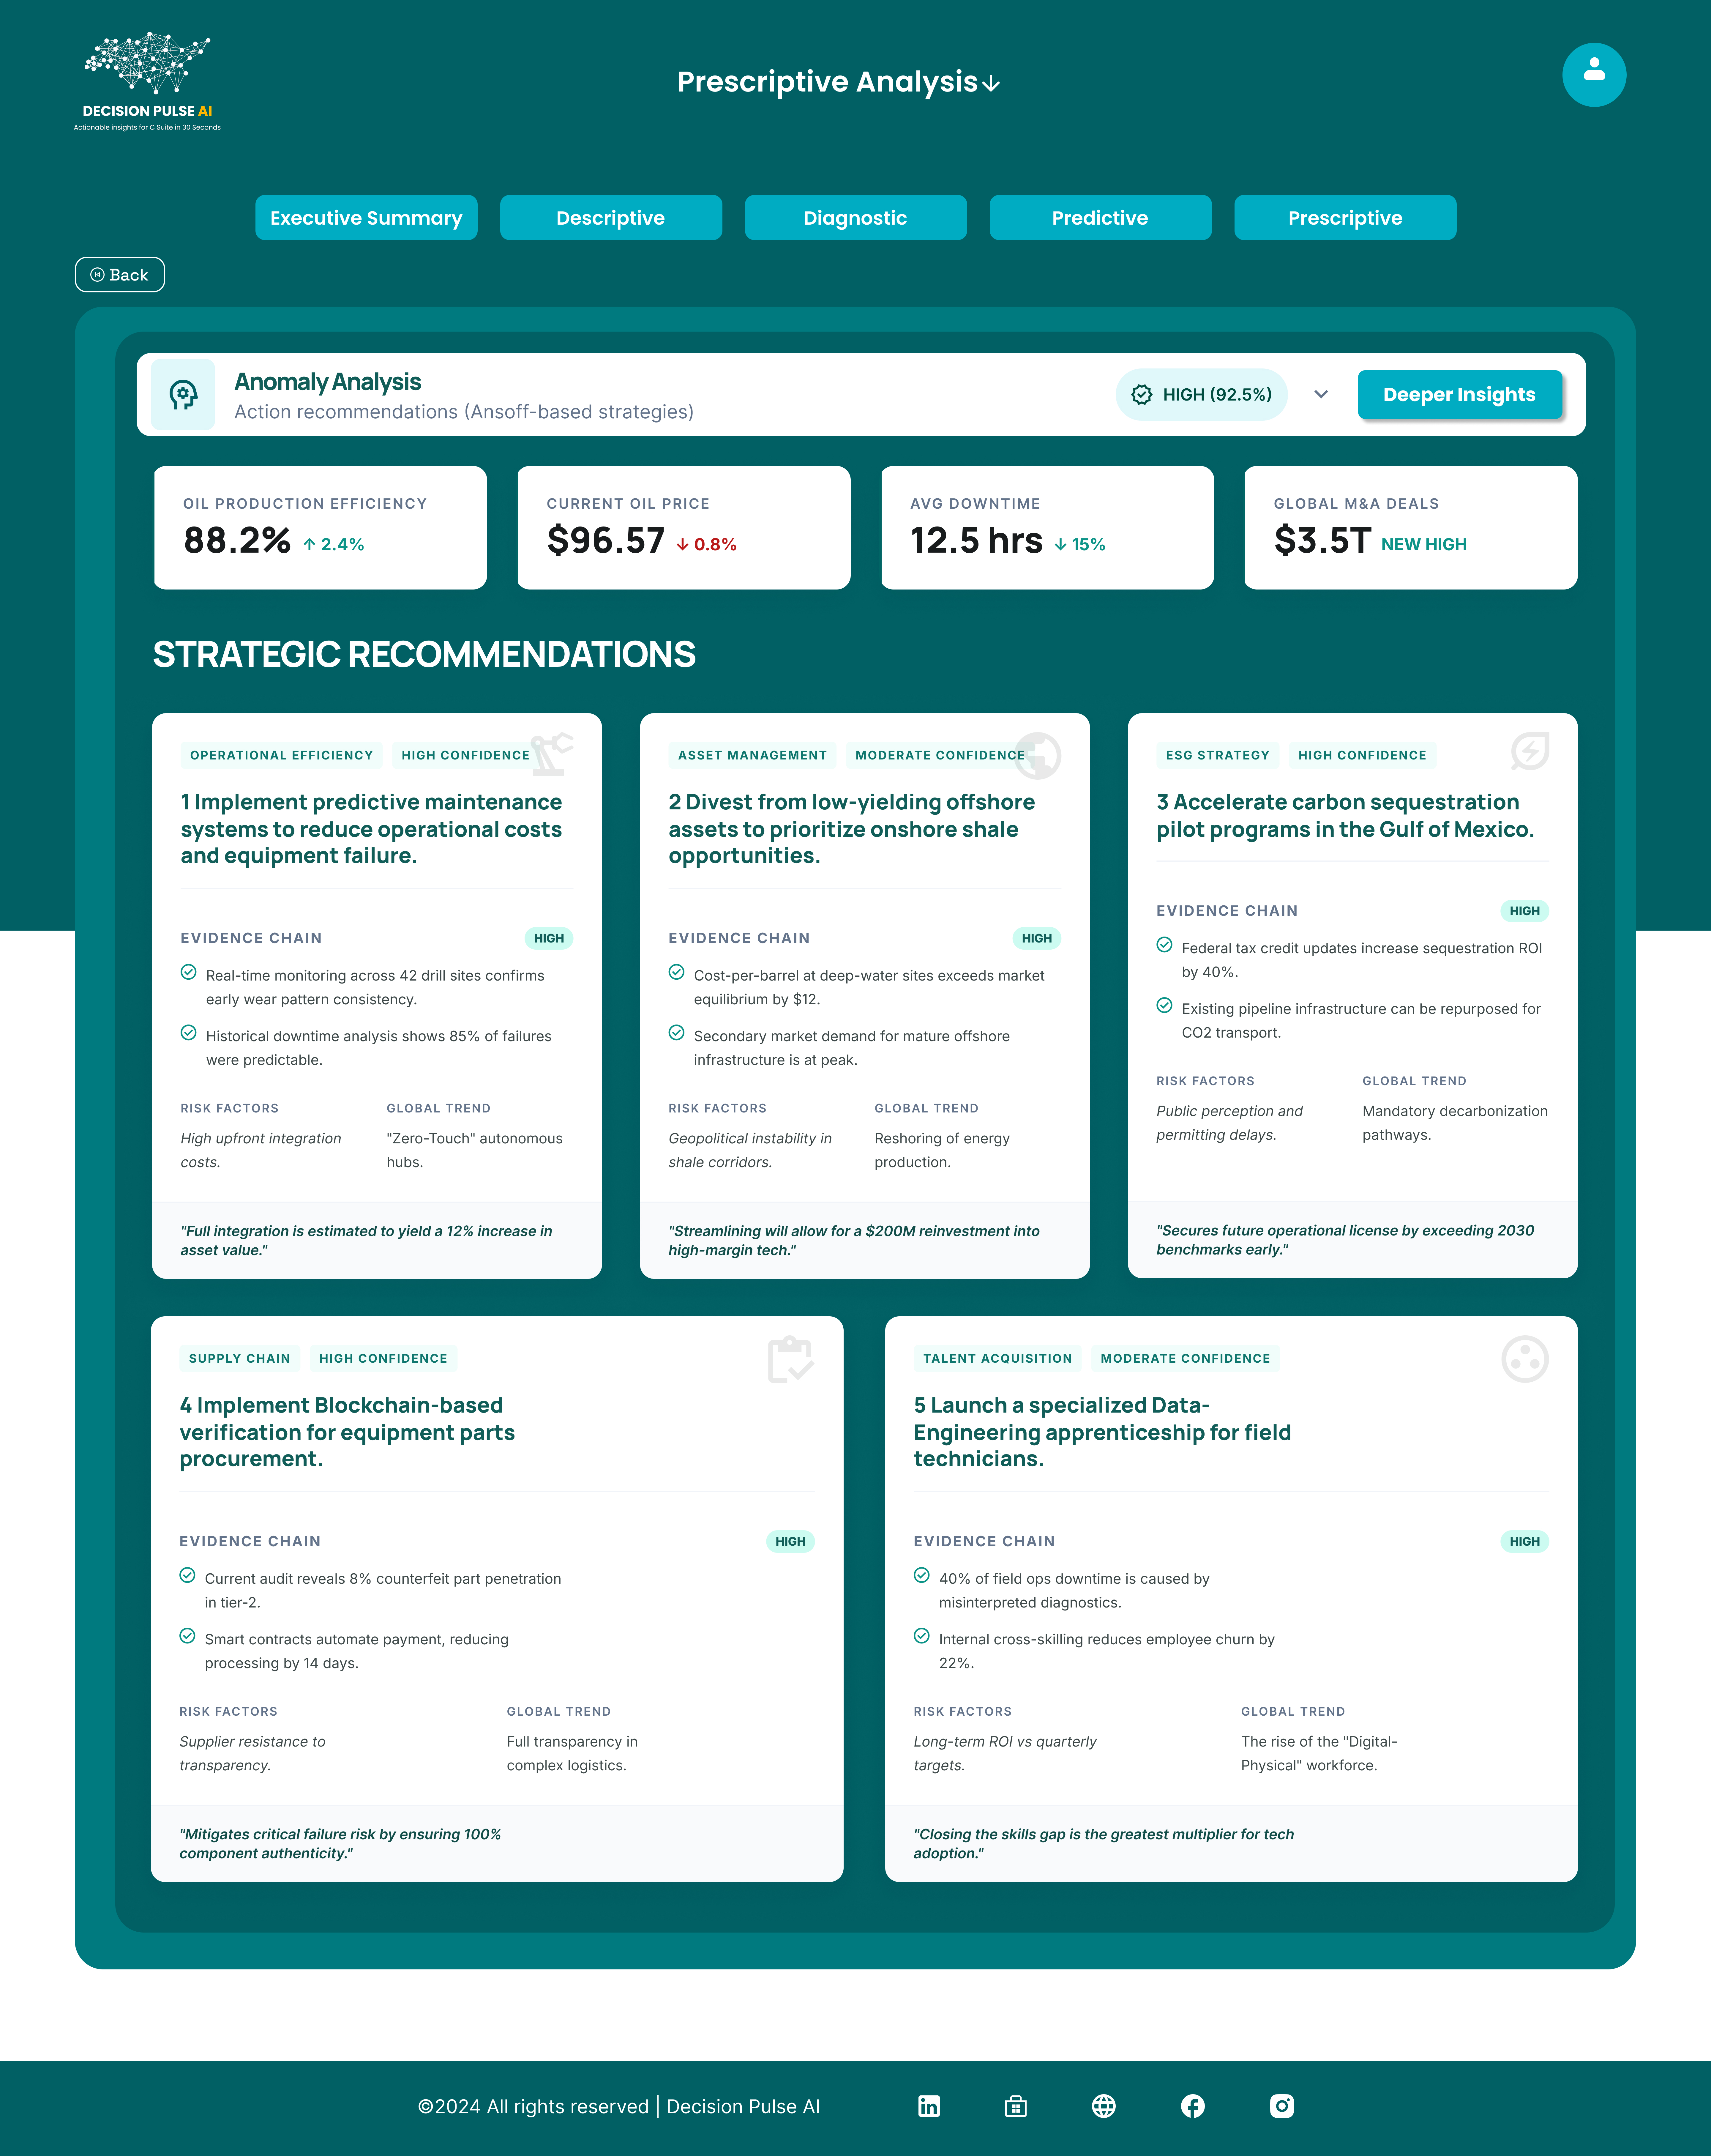
2. Insight-Led Design
Replace dashboards with Insight Cards:
Clear summaries, Highlight key trends, Show impact.
3. Action-Oriented UX
Every insight answers:
"So what?" and "What next?"
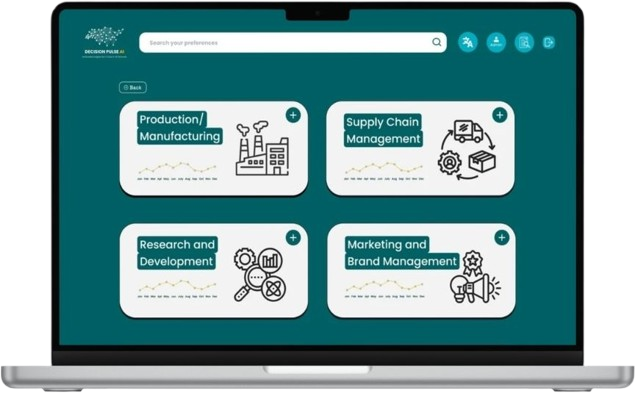
Information Architecture & User Flow
I created the core product flow. The goal was to eliminate unnecessary complexity and reduce cognitive load.
- Data Input (Upload / Connect sources)
- AI Processing Layer
- Insight Generation
- User Interaction (Chat + UI)
- Scenario Simulation
- Recommendations
Ideation & Wireframing
I explored multiple directions:
- Complex dashboard systems
- Hybrid dashboard + AI
- Chat-first minimal UI
Final Direction: AI-first + Insight-driven interface
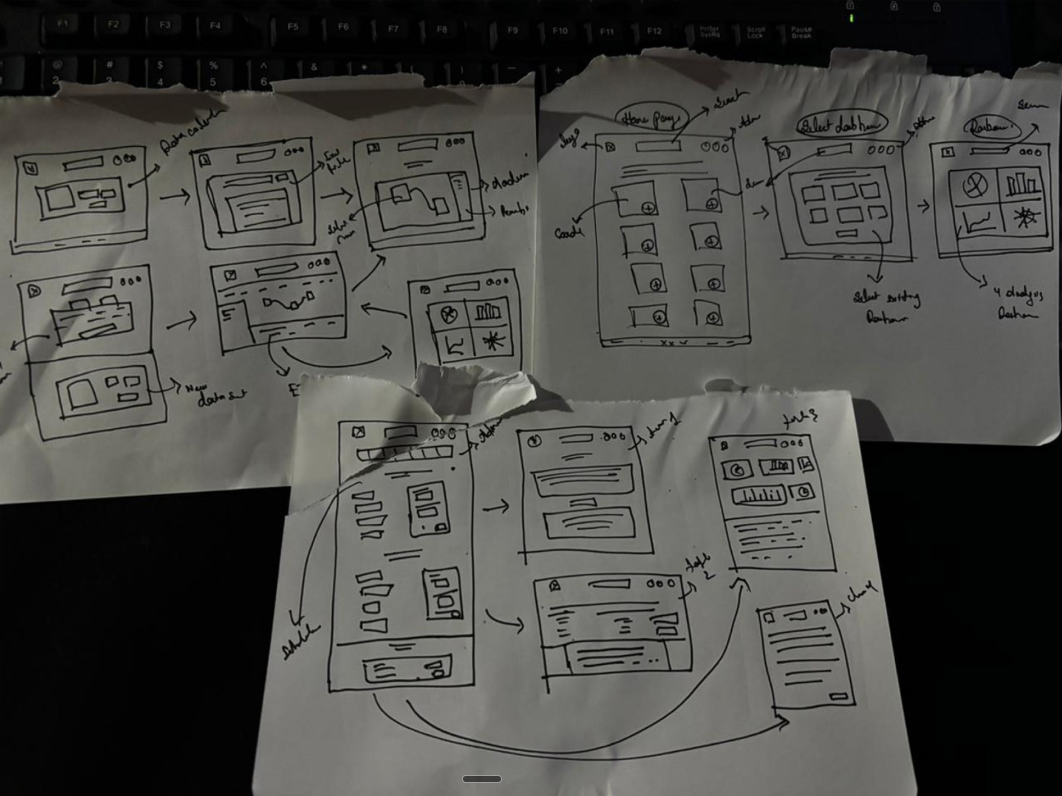
↑ Initial conceptual sketches and logic flows
UI Design System
I built the UI from scratch focusing on clarity.
Insight Cards
Human-readable summaries and visual highlights.
AI Chat Panel
Central interaction layer.
Scenario Simulation Module
Interactive controls for "What-if" analysis.
Minimal Data Visualizations
Only when necessary.
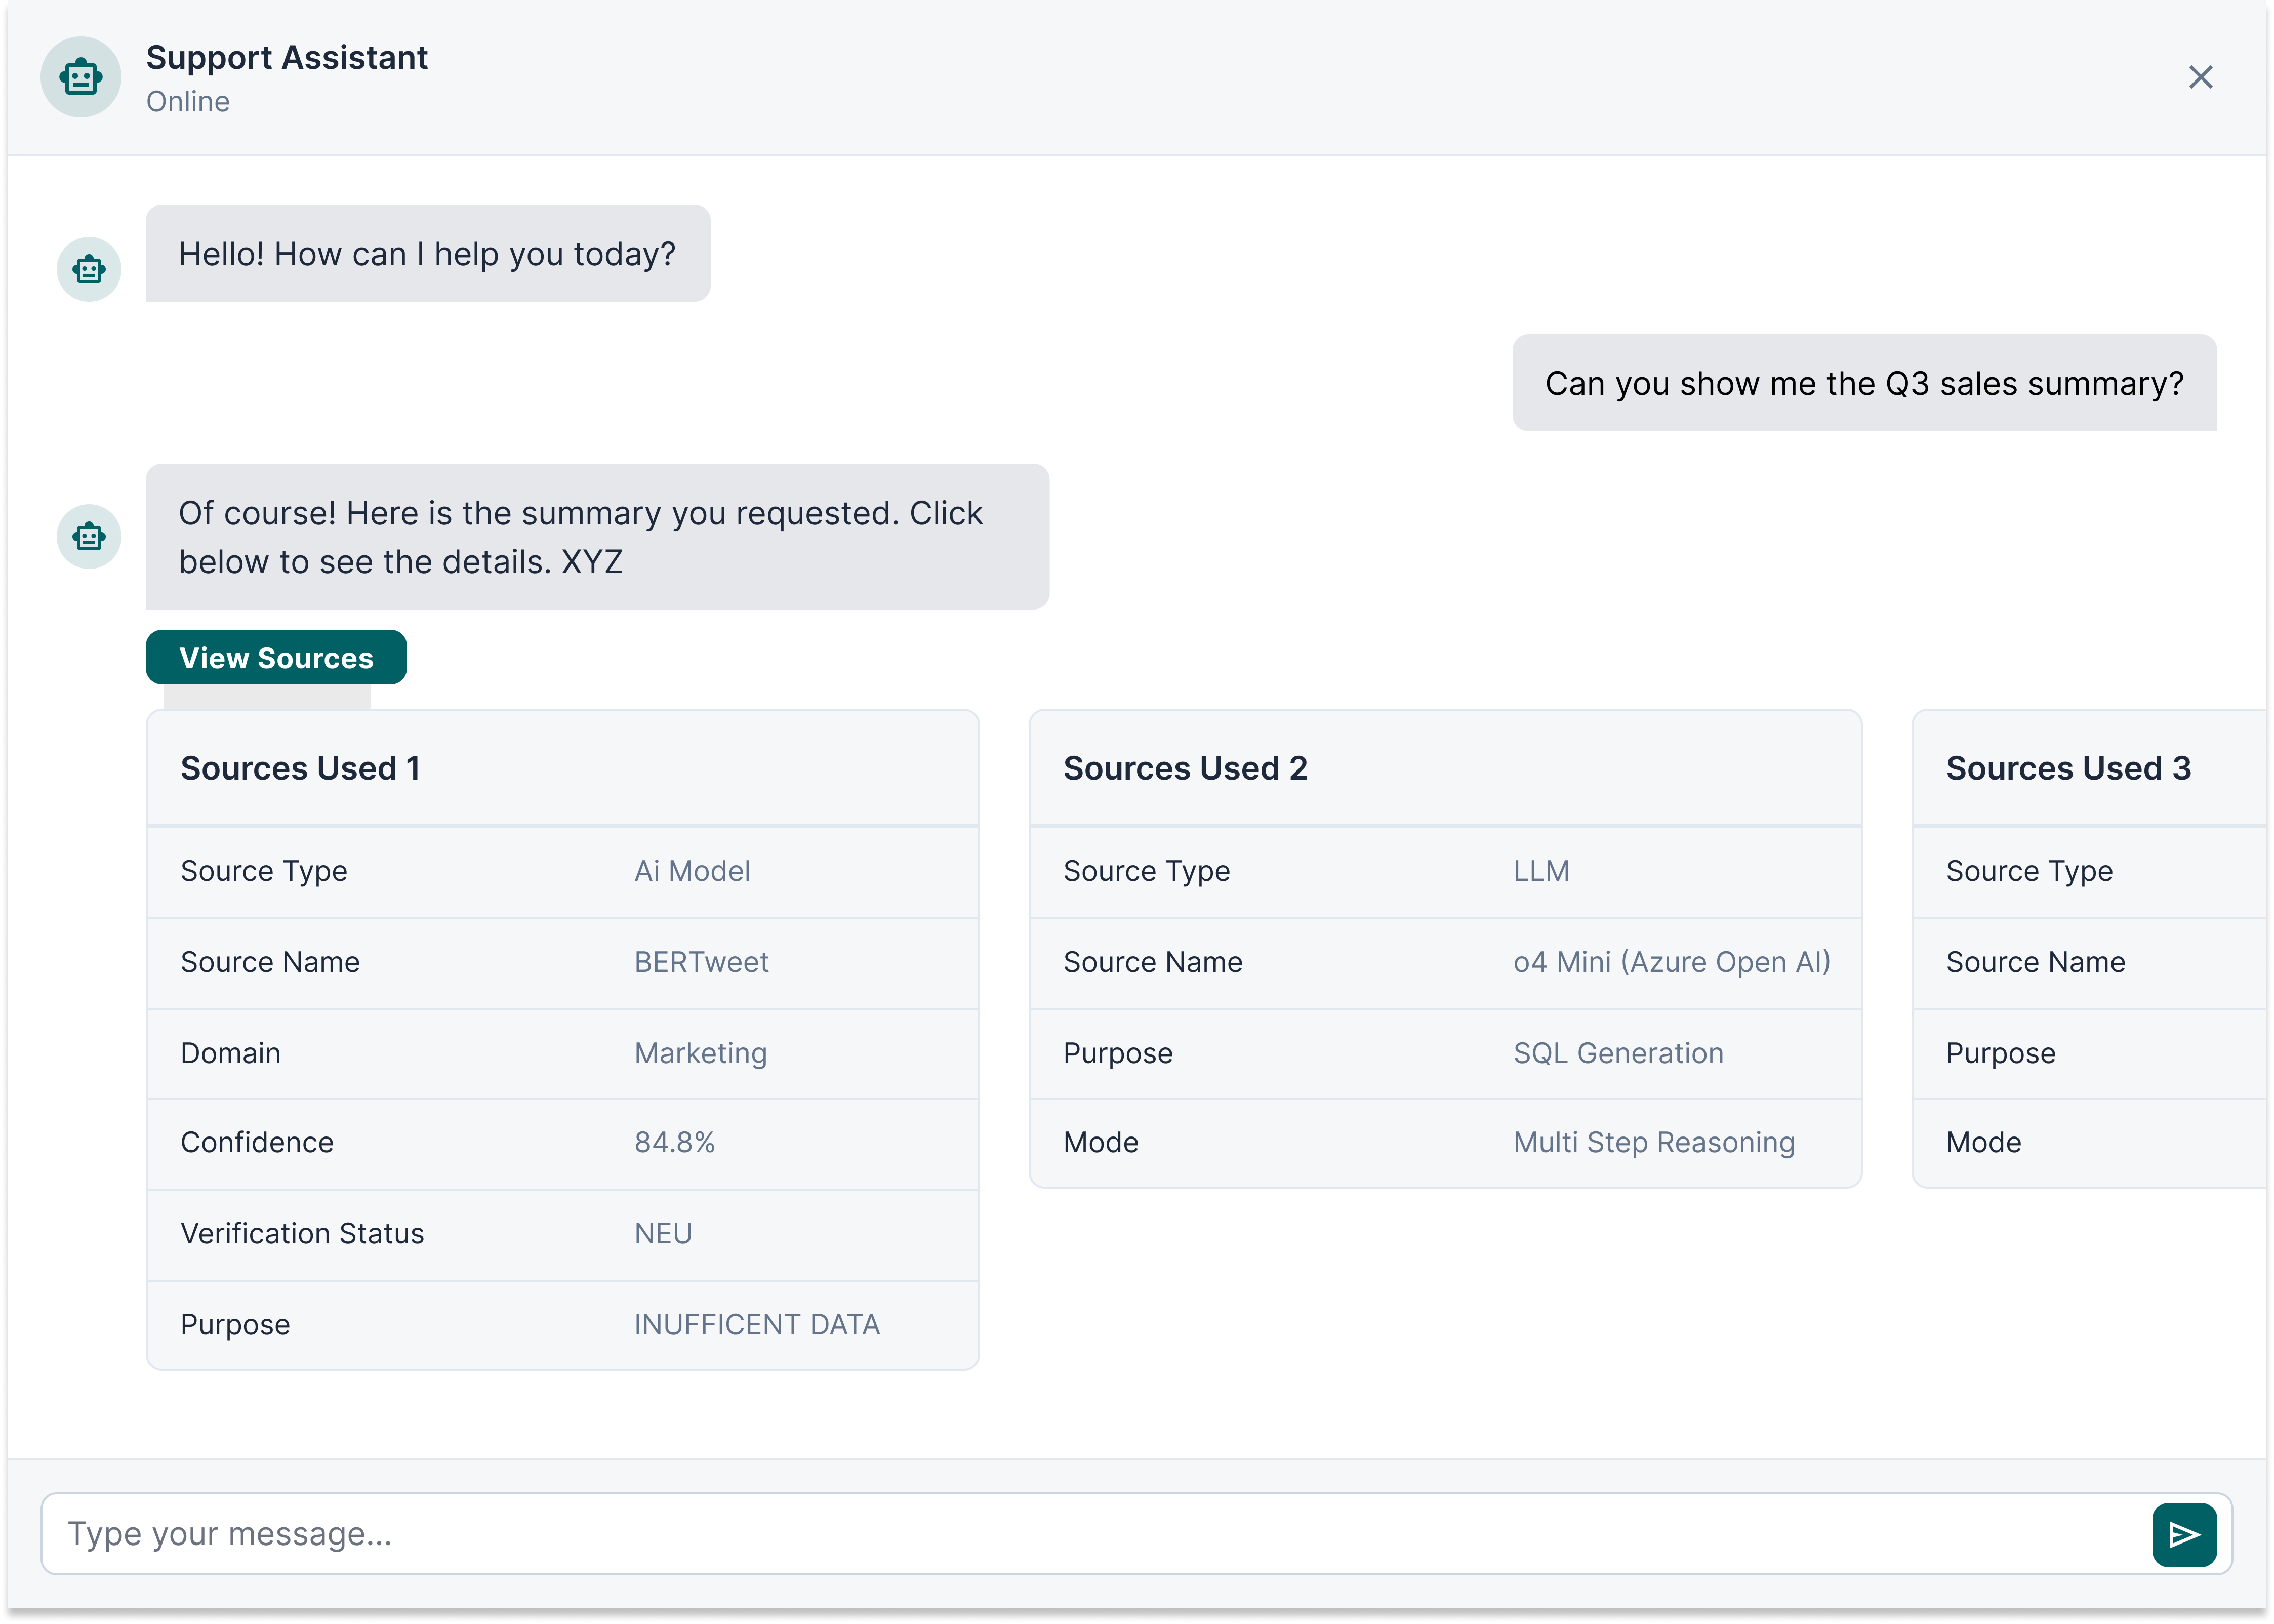
Designing AI Experience
Since this is an AI-driven product, I focused on:
Challenges
- Trust in AI
- Understanding AI outputs
- Avoiding black-box feeling
Solutions
- Explainable insights
- Structured responses
- Highlighting reasoning behind recommendations
Iteration & Refinement
During internal testing:
Issues Found
- Information overload
- Users confused by AI terminology
Improvements
- Simplified language
- Reduced visual noise
- Introduced progressive disclosure
Final Outcome
The final product experience:
- Enables users to go from data → decision in minutes
- Removes dependency on technical teams
- Makes AI-driven insights accessible to all user types
Key Learnings
- Designing from scratch requires strong problem framing
- AI products need clarity more than capability
- Simplicity is the hardest part of UX
- Users trust systems that explain themselves